![]()

| Recent Comments |
| Categories |
| Archives |
| Tags |
Mixclub ’22 – Session 13- Taste (Sunday 26 April, 2026)
MixClub ’22 is a group of (semi) professional mixing/mastering engineers who mix and master a multitrack every few months. We aim to produce this mix and master within a very limited time span as a challenge. See [here] for more information and [here] for the songs we mixed and mastered so far.
![]()
During the past month we had the 13th session during which we worked on the multitrack ‘It’s your thing’ from Bernard Purdie and friends. This multitrack was kindly provided by Telefunken Live From The Lab for educational and demonstrational purposes only. See also [here]. Below, my final master and the original. For the mix see [here].
My Final Master
Original
The 13th Session
In this mix session, with six participants, we proceeded as usual. Everyone made a first version of a mix and a master from the multitrack, and provided a short description of the main challenge, the mixing, and mastering process. Subsequently, each mix/master was evaluated by two other participants who provided feedback using a predefined template. Next, each participant made a revision of the mix and master based on the feedback received. Finally, each participant ranked all mixes and masters.
The Ranking
As in previous sessions, there was considerable variability in how participants ranked the songs. The exact reasons are not fully clear, but several factors likely contribute, including (i) differences in monitoring conditions and room acoustics in home studios, (ii) individual preferences, and (iii) varying emphasis on specific aspects of the mix and master.
For this sessions rankings were made by
- All participants (peers).
- Holger Schwedt who is a professional mixing engineer (the Golden standard)
- Two normal listeners (consumer) not being audio engineers or musicians.
The Peer Ranking
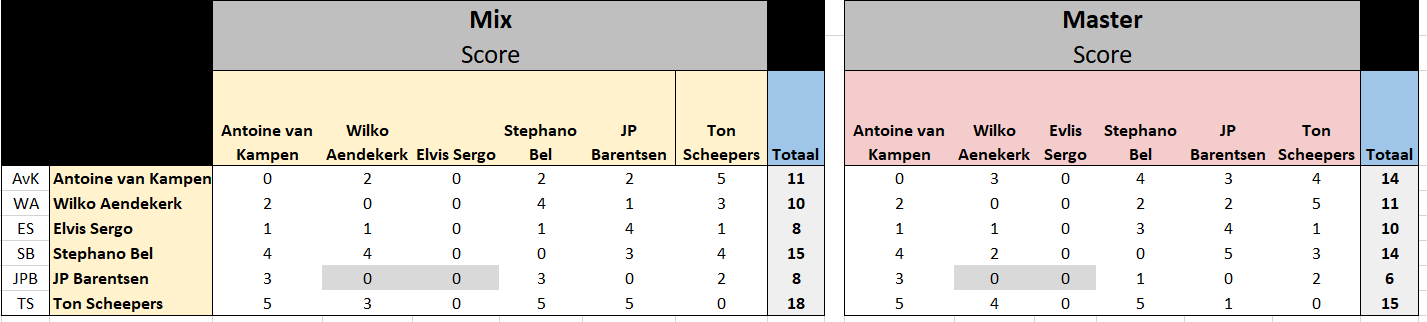
The results from the peer ranking shows a large variation as you can see from the next table with scores for the mixes and masters. Each master (rows) were ranked by all other participants (columns; peers) but the participants were not allowed to rank their own mix/master (zero in table). JP Barentsen was ranked by only four other participants (hence zeros highlighted in gray) and, consequently, this results in a lower overall score in the follow-up analysis.
The Golden Standard
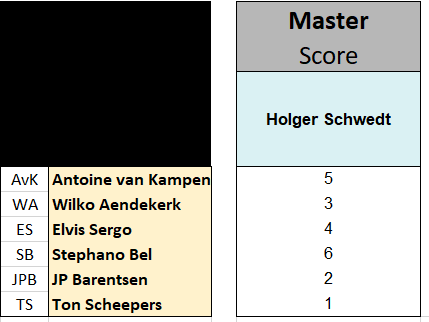
I asked Holger Schwedt (Shamrock Studios, the Netherlands) to rank the masters to serve as a golden standard. Holger evaluated mainly on basis of ’emotional impact’ of the masters.
Holger is a professional audio engineer who began his professional career at home in Leiden in an attic room with an 8-track recorder. Since 1982, he has been active as a mixer/producer. He has worked in various studios, including Wisseloord Studios, Bullet Sound Studios, ICP Studios, Fendal Sound Studios, Galaxy Studios, and Arnold Mühren’s studio. From the late 1990s until 2005, he worked as senior engineer and manager at John Ewbank’s Down Under Studios in Hilversum. In 2006, he started Shamrock Studios in Baarn. Due to its peaceful and leafy location, the complex is frequently used for international writing camps by publishing and recording companies such as Universal Music, Sony ATV, Cloud9, Topnotch, CTM, Strengholt, BMG, Talpa, 8Ball, and Warner. Behind the scenes, Schwedt has been involved in hundreds of chart-topping hits, including over 50 Radio538 Alarmschijven, Radio2 Talent songs, and 3FM Megahits. Twelve singles and thirteen albums have reached the #1 status.
The scores for the masters given by Holger are found in the next table.
The Consumers
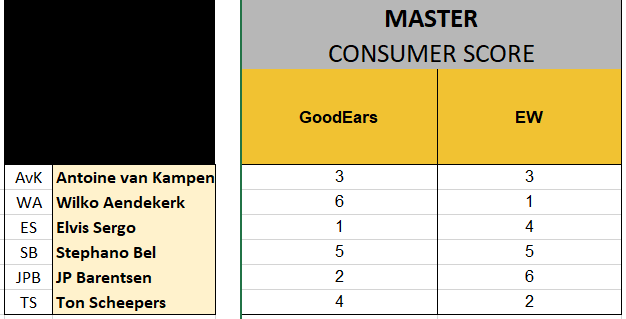
I also asked two persons (GoodEars and EW) who are not audio engineers nor musicians to also listen to the masters and to make a ranking. They likely focused much less on the technical aspects of a mix. Their scores are:
The Outcome
To analyze and compare the rankings, I made a several graphical representations. The full analysis report is attached below.
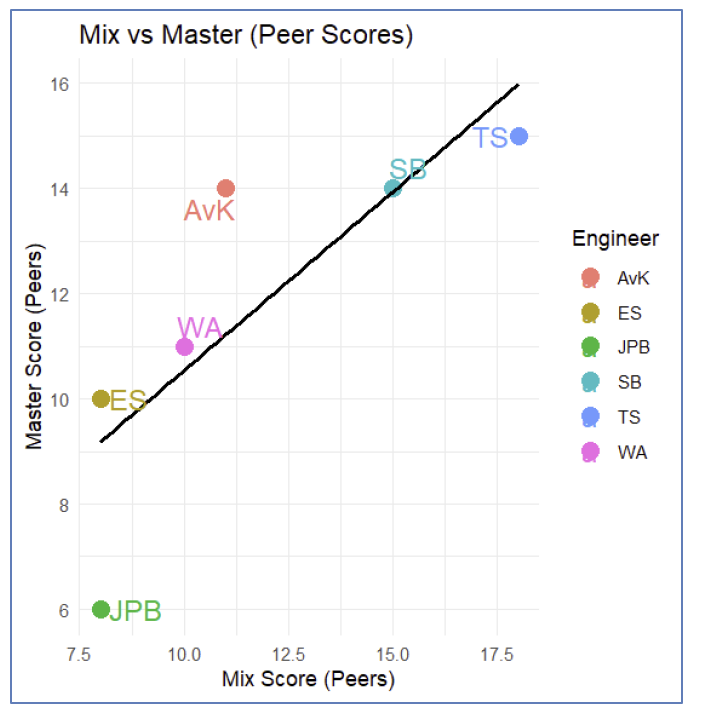
If we look at the Pearson correlation between the total score of the mixes given by the peers and the total score for the masters (by peers) then we see a relatively high correlation (r=0.81). Thus, engineers who make good mixes tend to also produce good masters. Note that JPB scores low because his scores were incomplete.
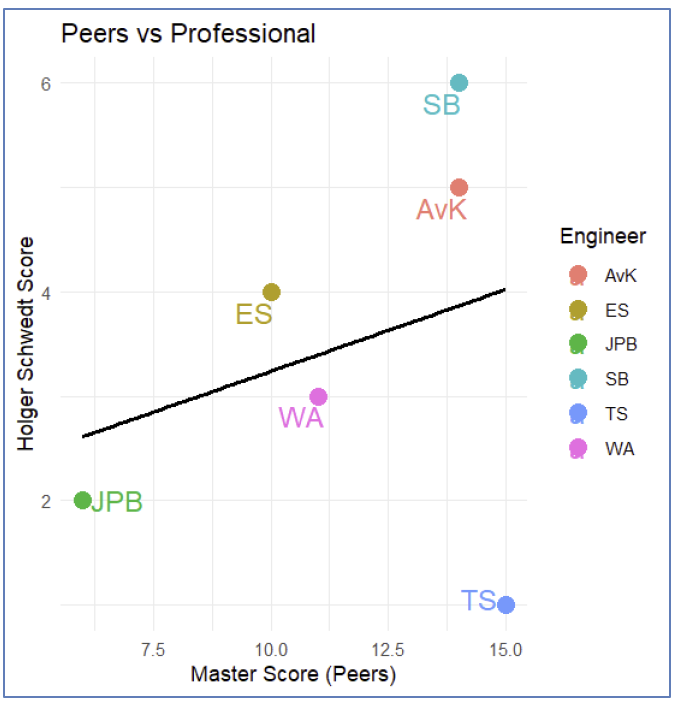
When comparing the total master scores from the peers with those given by Holger Schwedt (our reference standard), we observe only a weak correlation (r = 0.28). This indicates that Holger evaluates the masters differently from the peer group. A striking example is TS, which received a high ranking from the peers but was given the lowest score by Holger.
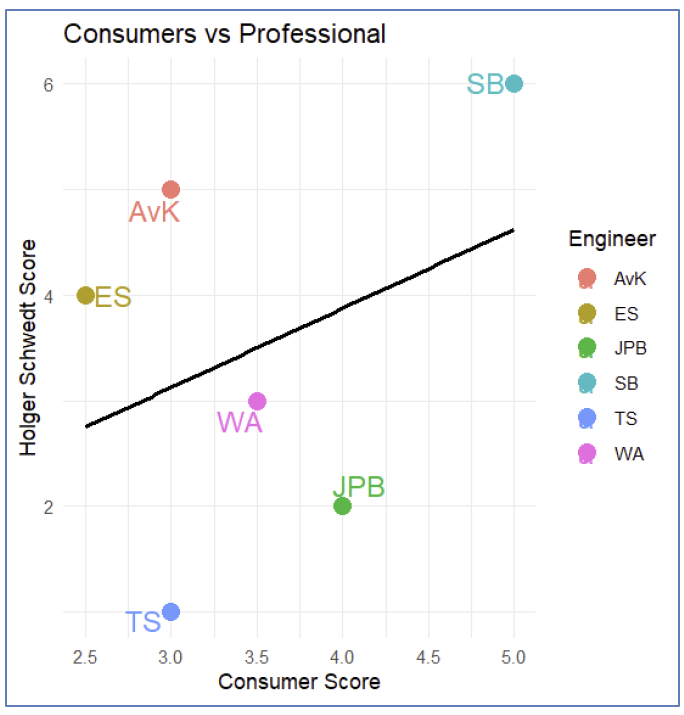
Similarly, if we compare the scores given by the consumers with the scores given by Holger, we find a low to moderate correlation (r=0.36). Thus, Holger seems to be more in line with what consumers want to hear. Not surprising!
Taste?
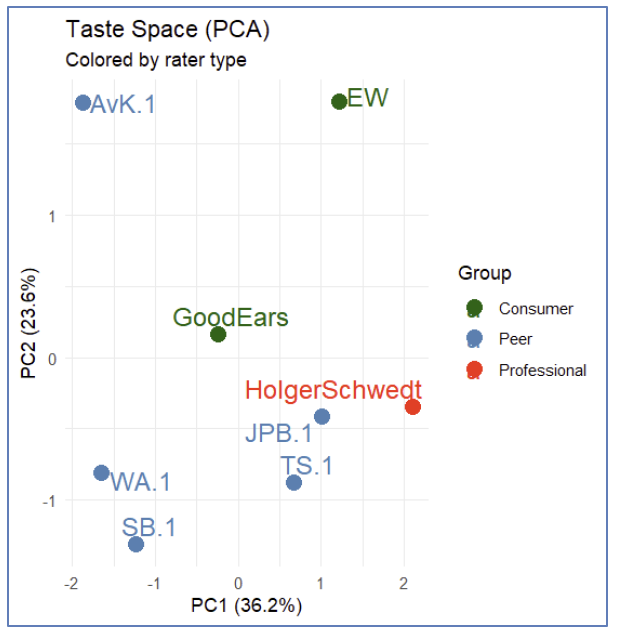
We can also examine how similar the evaluators are in their rankings using what I refer to as a “taste space” plot, based on a PPrincipal Component Analysis (PCA). This plot displays two principal components (PC1 and PC2). In essence, each evaluator can be represented as a point in a six-dimensional space (corresponding to the six masters), and PCA projects this high-dimensional space onto two dimensions to make it easier to visualize.
The distance between points reflects how similarly evaluators rank the masters. Points that lie close together indicate evaluators with similar ranking patterns, whereas points that are far apart indicate disagreement. The plot includes eight evaluators (ES is excluded because no master scores were provided), allowing us to directly compare their relative evaluation styles. For example, WA and SB are close together and, hence, tend to rank the masters in a similar way.
We can try to give an interpretation to PC1 and PC2. If we calculate the correlation between the scores of Holger and the scores of the other evaluators then we get the following:
| Evaluator | Correlation |
| Holger | 1.0 |
| JPB | 0.9 |
| TS | 0.5 |
| EW | 0.3 |
| GoodEars | 0.1 |
| WA | 0 |
| AvK | -0.4 |
| SB | -0.4 |
These correlations closely correspond to the distance from Holger along the PC1 axis. This suggests that PC1 can be interpreted as a measure of alignment with the professional reference. JPB and TS show ranking patterns similar to Holger Schwedt, whereas AvK’s rankings are largely opposite to his. Interestingly, this alignment in evaluation does not translate directly into performance. Although TS evaluates the masters in a way that is similar to Holger, this does not result in a high score for his own master. Conversely, AvK evaluates the masters quite differently from Holger, yet still receives a strong score for his own master.
The second principal component (PC2) captures additional variation that is largely independent of the professional evaluation, reflecting secondary differences in taste or perception. Broadly, PC2 appears to separate expert evaluators (who generally have negative PC2 scores, with AvK as an exception) from consumer listeners (who have positive PC2 scores). This suggests that PC2 represents a dimension along which consumers systematically differ from expert evaluators in how they assess the masters.
We can also consider the so-called loadings, which indicate how strongly a masters contributes to a principal component, i.e., which contrasts between the masters explain the differences in how evaluators rate them. The loadings are:
| Master | PC1 | PC2 |
| AvK | 0.418 | –0.572 |
| WA | 0.172 | -0.126 |
| ES | 0.460 | 0.033 |
| SB | 0.456 | 0.438 |
| JPB | 0.188 | 0.667 |
| TS | –0.584 | 0.136 |
For PC1, we see that the master of TS has a strong negative loading while SB, ES, and AvK have strong positive loadings. Thus, PC1 represents a preference for the master of TS (by the peers) vs preference for the masters of SB/ES/AvK (by Holger). With respect to PC2 we see that there is a contrast between the masters of JPB/SB vs the master of AvK. Thus, these masters are important to distinguish consumer listeners from expert evaluators.
The famous biplot
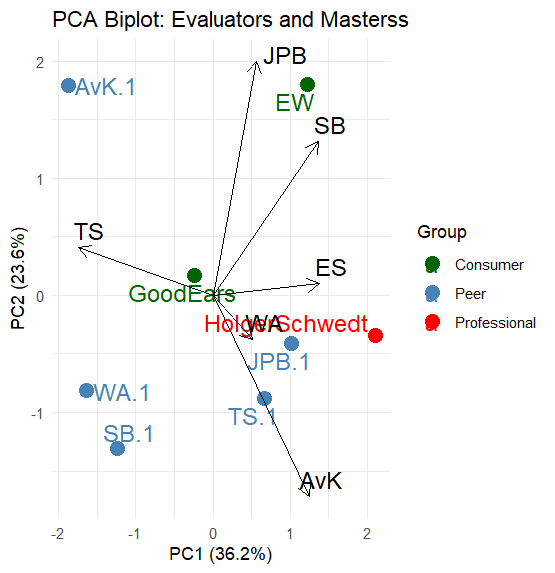
We can also show this in a biplot, which is a compact way to visualize both how people evaluate something and what drives their differences. In our case, each point represents an evaluator, and each arrow represents a master. Evaluators that appear close together in the plot tend to rate the masters in a similar way, while those that are far apart disagree more strongly. The arrows show how each master contributes to these differences.
The length of an arrow determines how important a master is in distinguishing between evaluators (e.g., the master of JPB seems to make a difference, but this is because he was not evaluated by to peers and hence has a score that deviates from the others).
The direction of an arrow is particularly informative. The direction of an arrow always shows how a song contributes to variation in the data. Alignment with PC1 means it drives the main differences (“professionalism”), while alignment with PC2 means it drives secondary, independent differences. (e.g., consumer preference). If an evaluator lies in the direction of a song’s arrow, it means they tend to give relatively higher scores to that master (e.g., TS has given a high score to AvK and WA). If they lie in the opposite direction, they tend to rate it lower (e.g., SB.1 has given a low score to JPB).
The angles between the arrows reveal relationships between masters. When two arrows point in roughly the same direction, the corresponding masters are rated similarly by evaluators (positive correlation). If two arrows point in opposite directions, the masters tend to be rated in opposite ways (negative correlation). When arrows are close to perpendicular, the ratings of those masters are largely independent.
In this way, a biplot shows in a single figure both who agrees with whom and which masters explain those agreements and disagreements**.
The winner!
We have a winner! The master of Stephano Bel was rated best by Holger.
Conclusion
This Mixclub’22 session again highlighted how challenging it is to consistently evaluate mixes and masters. As in previous sessions, there was substantial variability in how participants ranked the submissions. While some agreement exists, the overall spread in rankings shows that evaluators do not share a single, unified reference when judging audio quality.
A comparison with the scores from Holger Schwedt, used here as a professional reference, reveals only a weak correlation with the peer rankings. This indicates that the criteria used by the group differ from those applied by an experienced professional. A striking example is the TS master, which was rated highly by peers but received the lowest score from Holger, illustrating how differently the same material can be perceived.
To better understand these differences, a Principal Component Analysis (PCA) was used to map evaluators into a “taste space.” In this representation, evaluators who rank the masters similarly appear close together, while those who disagree are farther apart. The analysis reveals two main patterns. The first (PC1) captures alignment with the professional reference: evaluators positioned similarly to Holger tend to rank the masters in a comparable way, whereas others deviate from this pattern. Interestingly, being aligned with the professional in evaluation does not necessarily translate into producing the highest-rated master, highlighting that judging and producing are distinct skills.
The second pattern (PC2) reflects a systematic difference between expert evaluators (peers and the professional) and consumer listeners. This suggests that beyond technical assessment, there is an additional perceptual dimension that distinguishes trained listening from general audience preferences.
Overall, the results show that differences in ranking are not random, but arise from identifiable and structured differences in listening perspective. Understanding these differences is key to improving both evaluation and production skills.
Recommendations
Improving consistency in how we evaluate mixes and masters is not just a matter of experience, but also of developing a shared frame of reference. One of the most effective ways to do this is by regularly calibrating our ears. This means comparing our judgments not only with each other, but also with a trusted professional reference such as Holger Schwedt. Listening to high-quality commercial releases alongside the submissions can also guide emotional impact and, more technical aspects like tonal balance, dynamics, and overall translation.
A more structured approach to evaluation can further reduce variability. Rather than relying purely on intuition, it helps to consciously listen for specific aspects such as tonal balance, dynamics, stereo image, vocal clarity, and how well a mix translates across playback systems. Using a consistent checklist, like we do in the Mixclub, encourages more objective comparisons and makes it easier to understand where differences in opinion come from.
Monitoring conditions also play a crucial role. Most of us work in home studios where acoustics and playback systems vary widely. This can strongly influence how a mix is perceived. Cross-checking mixes on multiple systems (headphones, speakers, and everyday listening environments) can help mitigate these differences and lead to more robust evaluations.
Another important step is learning to separate personal preference from technical quality. It is easy to favor a mix simply because it sounds pleasing or familiar, but this does not necessarily mean it is well balanced or will translate well across systems. Developing the habit of asking whether a mix is technically sound, rather than just enjoyable, perhaps helps bring evaluations closer to a professional standard. However, as mentioned by Holger, he mainly evaluated on emotional impact……
Comparative listening is particularly powerful in this context. Evaluating mixes side by side, rather than in isolation, makes differences more apparent and helps establish a clearer ranking. It shifts the focus from absolute judgments to relative ones, which is often more reliable.
Perhaps most importantly, disagreement within the group should be seen as an opportunity rather than a problem. When rankings differ significantly (especially from a professional reference) it is worth exploring the reasons behind these differences. Understanding whether they arise from tonal balance, dynamics, or other factors can provide valuable insight and accelerate learning.
Documents


